Emphasis:
Geospatial Mapping
Graphic Design
Data Visualization
Geospatial Mapping
Graphic Design
Data Visualization
Children’s Health & Diet
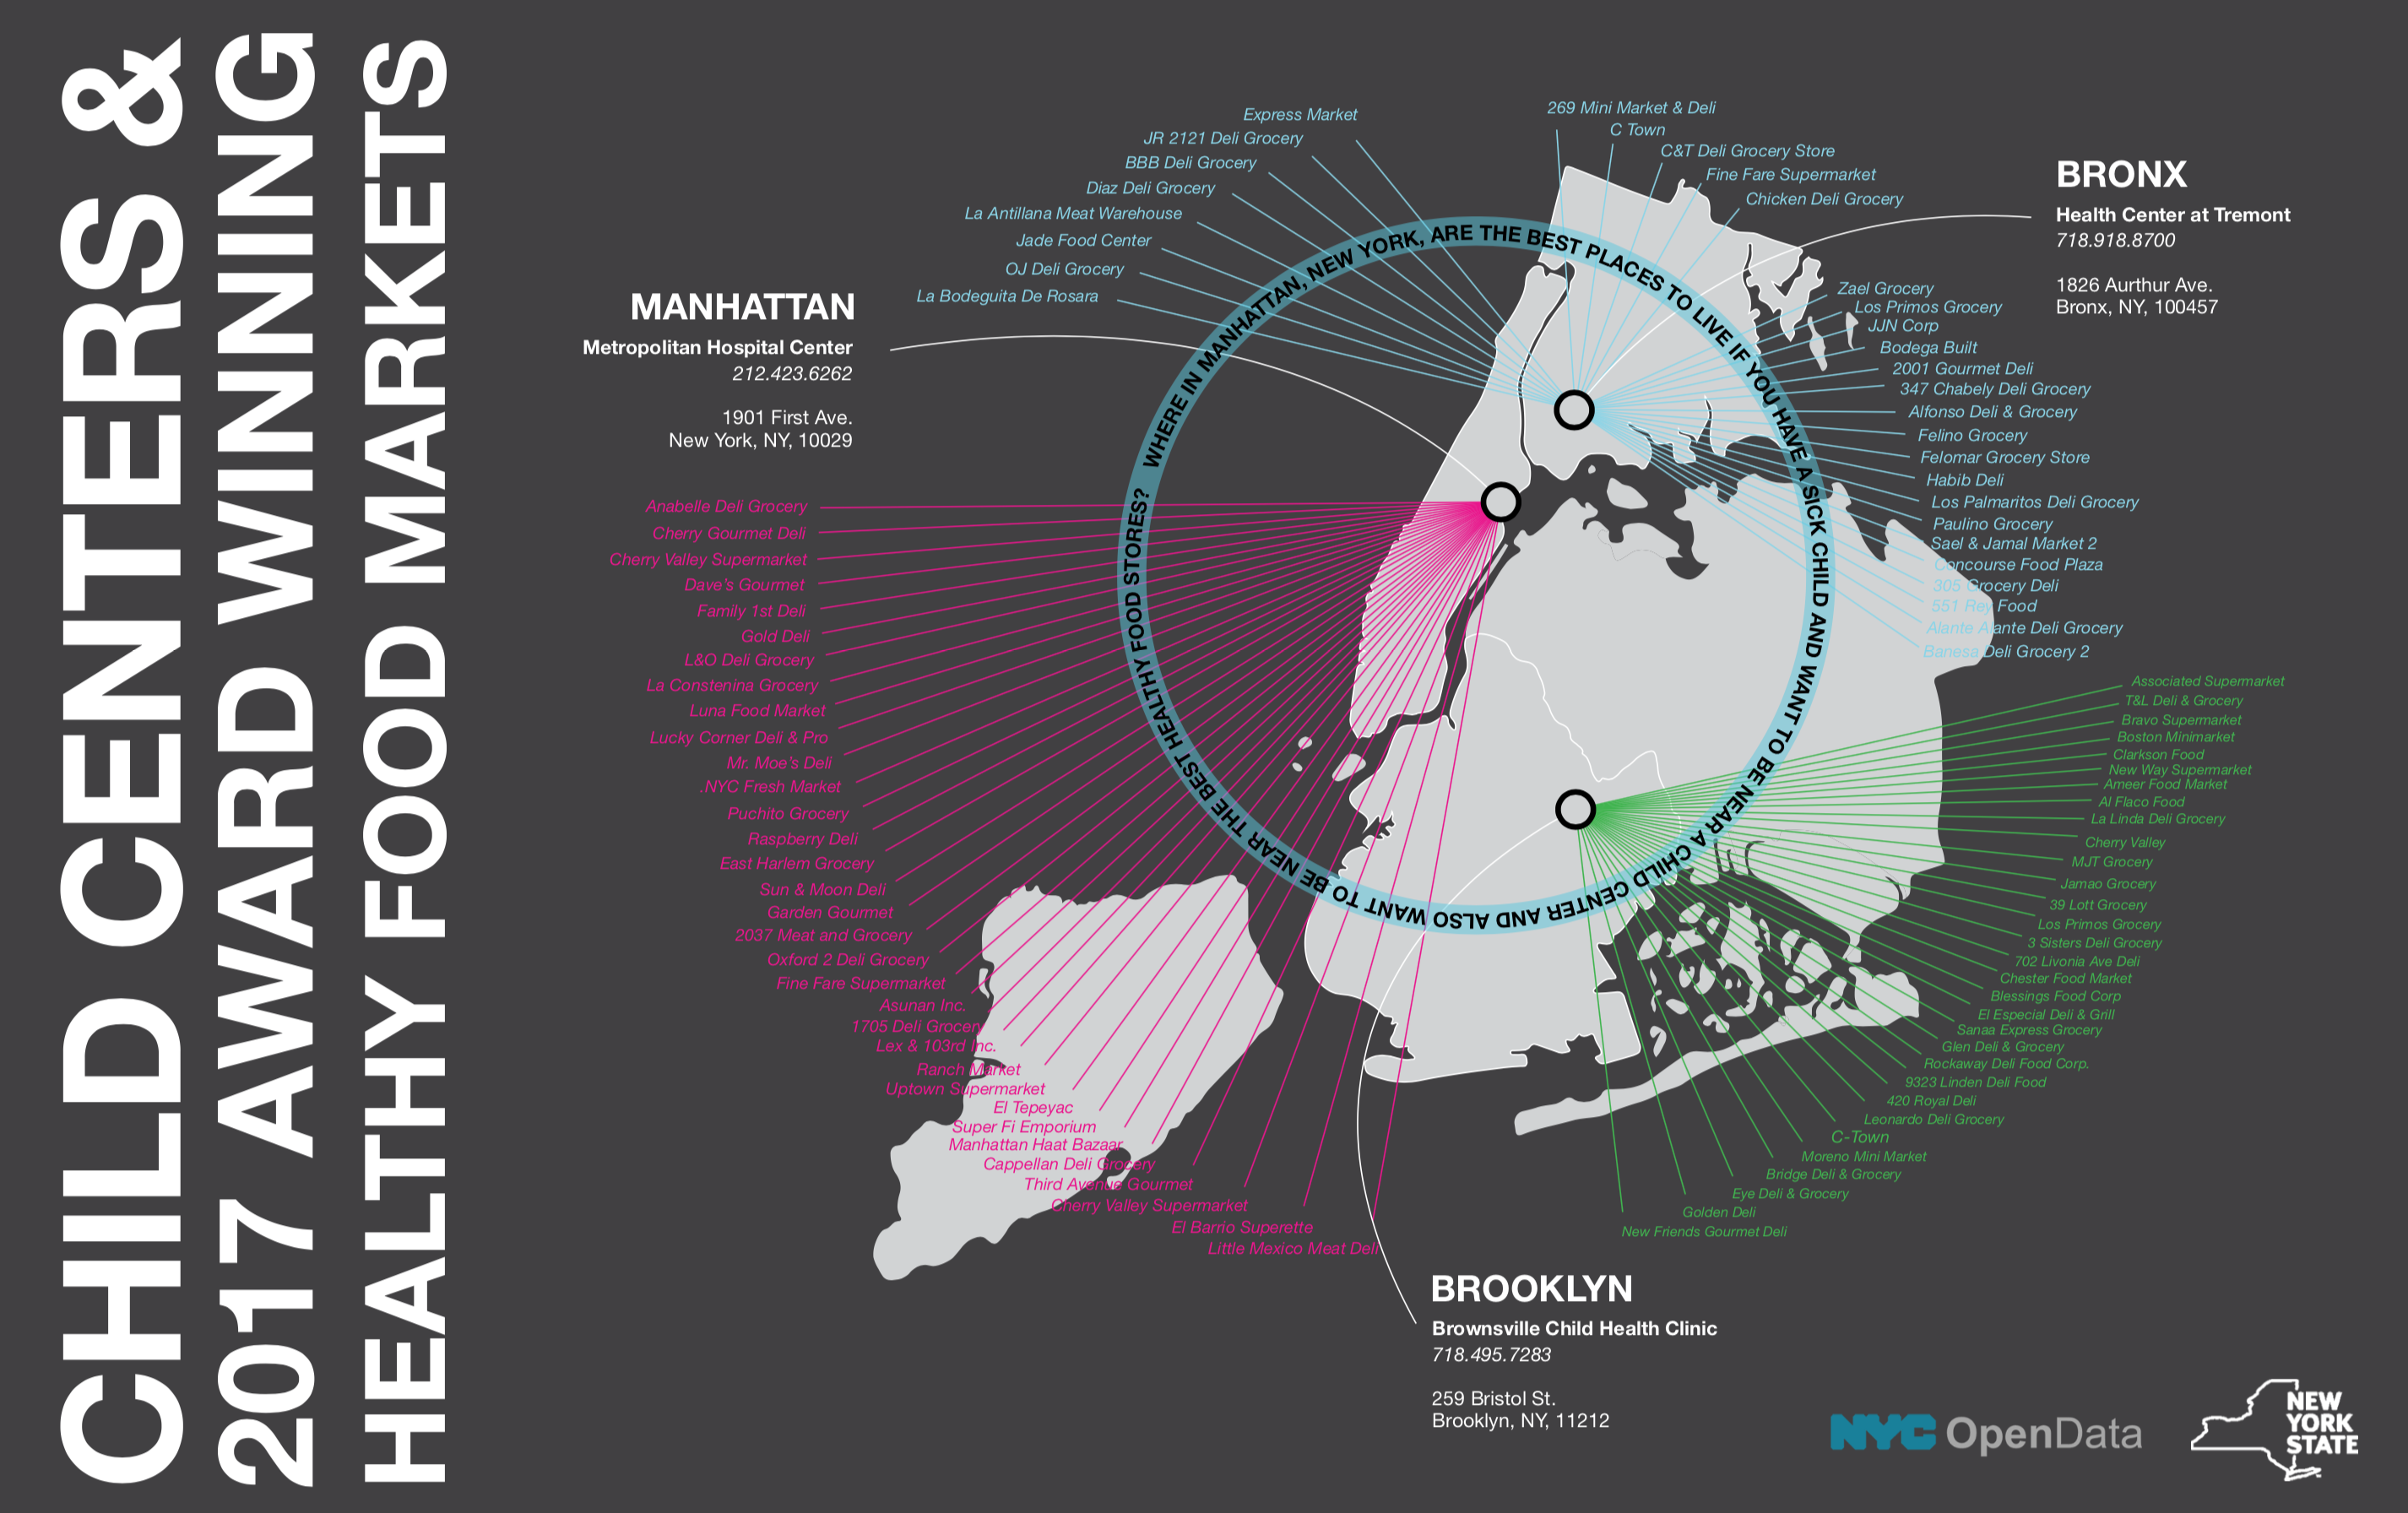
Where in the five borough of New York City is the best place to live if you have a child who is chronically ill and needs to be near child centers and also want to be less than a half mile radius to the best healthy food stores?
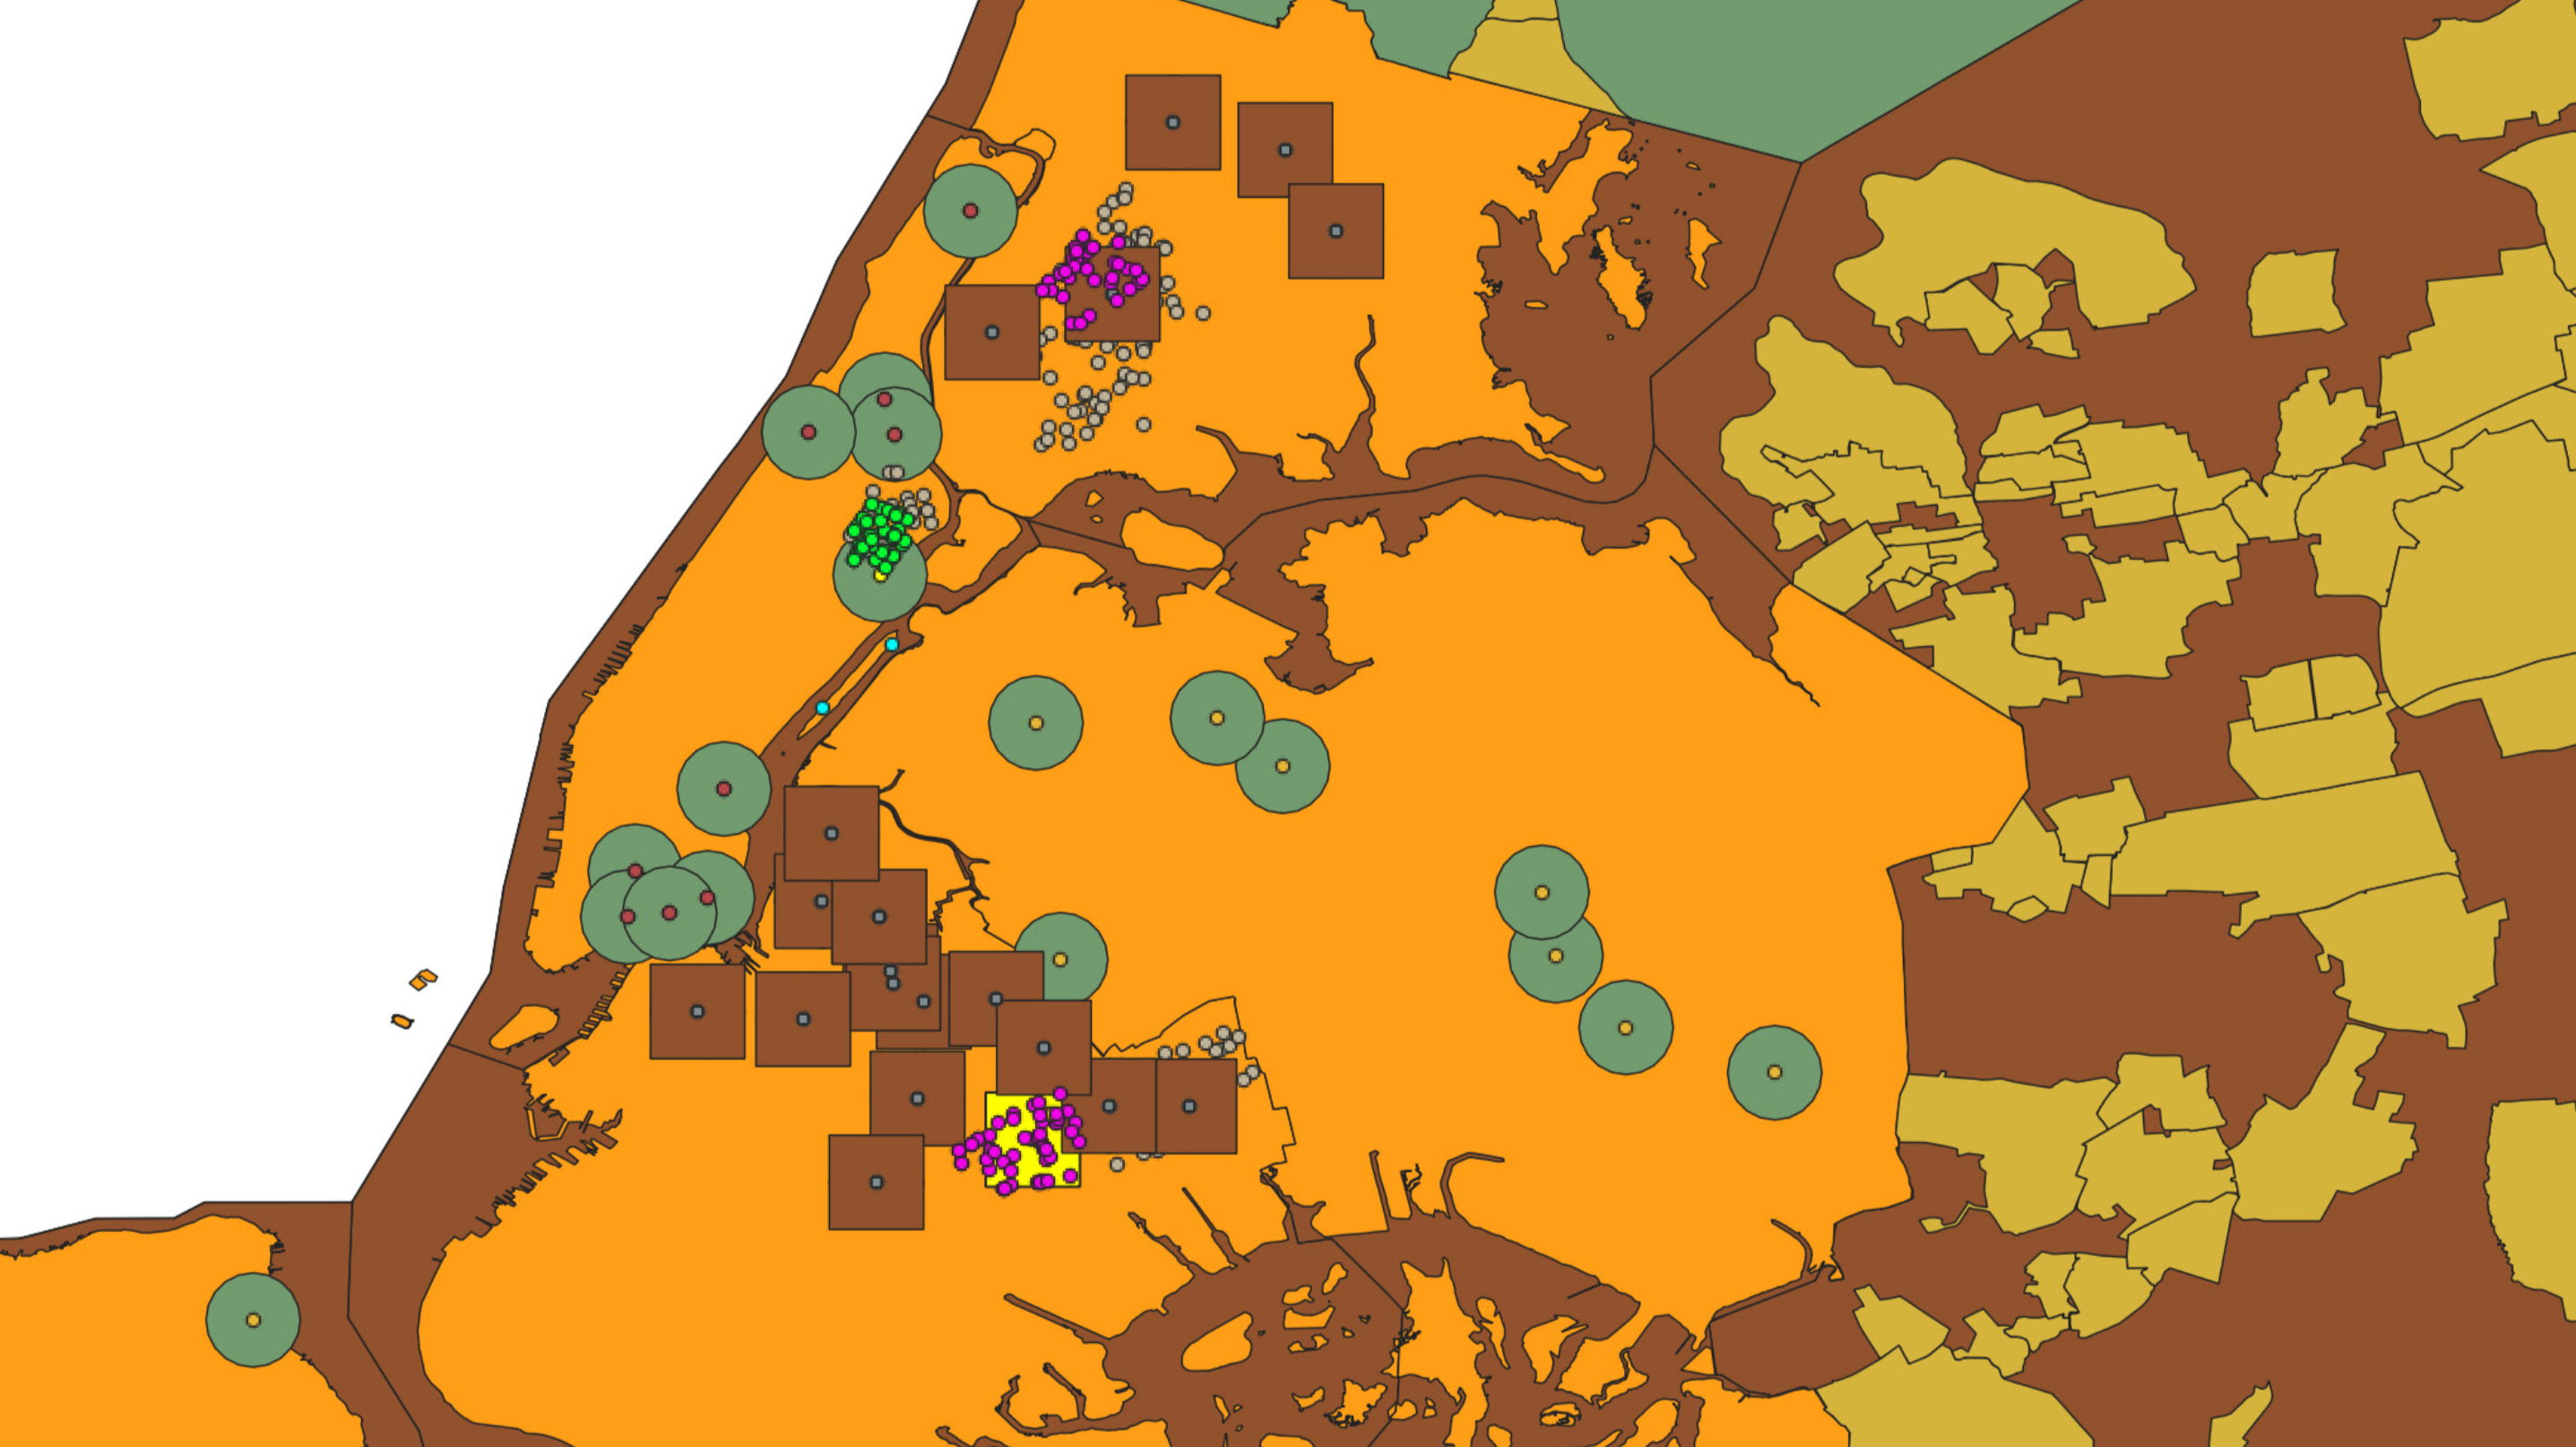
Through a series of steps using QGIS and conversions of text files and CSV files to SHP files and readable files for QGIS, I was able to navigate a way through to identifying child centers closest to the highest ranked healthy food stores in the five boroughs of New York.
Using what I found by geospatial mapping, I was able to create a visualization that would be easier to read based off of what I was able to parse out.